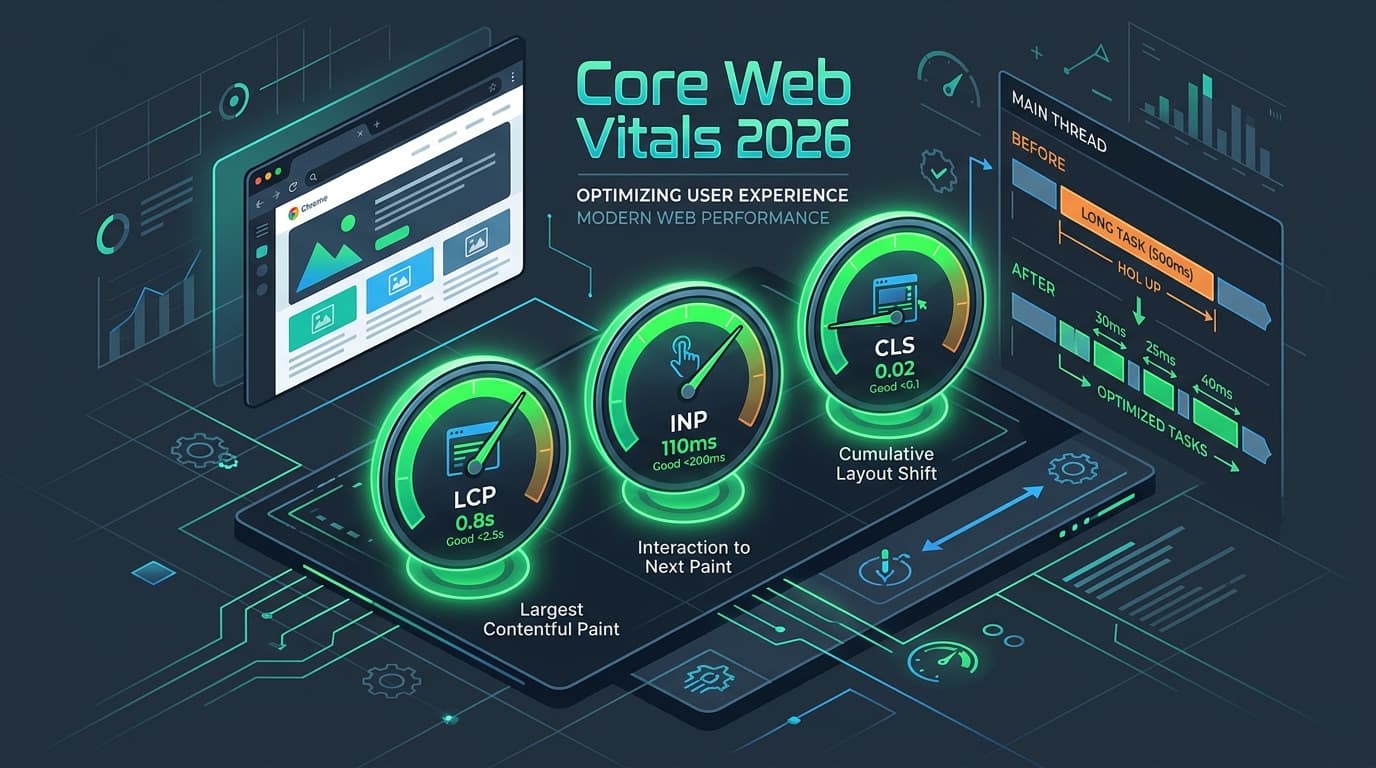
Core Web Vitals are Google's user-experience metrics for loading speed, responsiveness and visual stability. They are a confirmed ranking signal, but more importantly they track the moments where visitors give up: a hero image that takes four seconds to appear, a "Add to cart" button that freezes, or a layout that jumps just as someone taps a link.
This guide explains what each metric measures, how to find the real cause of a poor score, and the specific fixes that move the needle — in priority order.
1. The Three Core Web Vitals and Their Thresholds
Google assesses each metric at the 75th percentile of real-user visits (field data from the Chrome UX Report), split by mobile and desktop.
| Metric | What it measures | Good | Needs improvement | Poor |
|---|---|---|---|---|
| LCP — Largest Contentful Paint | When the main content (usually the hero image or headline) finishes rendering | ≤ 2.5s | 2.5s – 4.0s | > 4.0s |
| INP — Interaction to Next Paint | How quickly the page visually responds after a click, tap or key press | ≤ 200ms | 200ms – 500ms | > 500ms |
| CLS — Cumulative Layout Shift | How much visible content unexpectedly moves | ≤ 0.1 | 0.1 – 0.25 | > 0.25 |
INP replaced First Input Delay (FID) in March 2024. It is much stricter: FID only measured the delay before the first interaction started processing, while INP measures the full latency of every interaction and reports roughly the worst one.
2. Measure First: Field Data vs Lab Data
- Field data (what Google ranks on): Google Search Console → Core Web Vitals report, PageSpeed Insights "Discover what your real users are experiencing", and the CrUX dashboard.
- Lab data (for debugging): Lighthouse and the Chrome DevTools Performance panel. Lab tests use a single simulated device, so they will not always match field results — especially for INP, which needs real interactions.
- Your own RUM: Add the
web-vitalslibrary to report metrics, with attribution, to your analytics.
import { onINP, onLCP, onCLS } from 'web-vitals/attribution';

function send(metric) {
  navigator.sendBeacon('/api/vitals', JSON.stringify({
    name: metric.name,
    value: metric.value,
    rating: metric.rating,
    page: location.pathname,
    // Tells you WHICH element or script caused the score
    target: metric.attribution?.interactionTarget || metric.attribution?.element,
  }));
}

onINP(send);
onLCP(send);
onCLS(send);
3. How to Fix INP (Interaction to Next Paint)
INP is the metric most sites fail today. Every interaction has three phases: input delay (main thread busy with something else), processing time (your event handlers run) and presentation delay (the browser recalculates layout and paints). Fix whichever phase dominates.
A. Break up long tasks
Any JavaScript task over 50ms blocks the main thread. Yield back to the browser between chunks of work so it can paint the response first:
// Yield to the main thread so the browser can paint
function yieldToMain() {
  if ('scheduler' in window && 'yield' in scheduler) {
    return scheduler.yield();
  }
  return new Promise((resolve) => setTimeout(resolve, 0));
}

button.addEventListener('click', async () => {
  showSpinner();          // 1. Update UI immediately
  await yieldToMain();    // 2. Let the browser paint it
  await saveToServer();   // 3. Heavy work afterwards
  sendAnalytics();
});
B. Audit third-party scripts
Chat widgets, tag managers, heatmaps and A/B testing tools are the most common cause of poor INP. Remove scripts you no longer use, load the rest with defer or after user interaction, and move tracking to server-side tagging where possible.
C. React and Next.js specifics
- Wrap non-urgent state updates (filtering large lists, search results) in
startTransitionso typing stays responsive. - Use React Server Components to ship less JavaScript to the client in the first place.
- Virtualise long lists and avoid re-rendering whole pages on every keystroke.
- Keep the DOM small — pages with more than ~1,500 nodes make every layout recalculation slower.
4. How to Fix LCP (Largest Contentful Paint)
Break LCP into four parts: server response time (TTFB), resource load delay, resource load time and render delay.
- Make the LCP image discoverable immediately. Never lazy-load the hero image. Add
fetchpriority="high"(in Next.js, thepriorityprop onnext/image). - Serve modern formats at the right size. AVIF or WebP with responsive
srcset; a mobile visitor should not download a 2,400px image. - Cut TTFB. Cache HTML at the edge (CDN), use static generation or ISR, and avoid slow database calls on the critical path. Aim for TTFB under 800ms.
- Remove render-blocking resources. Inline critical CSS, defer non-critical JavaScript, and self-host fonts with
font-display: swap. - Avoid client-side rendered heroes. If the headline only appears after JavaScript runs, LCP waits for your entire bundle.
<!-- Preload the hero and give it top priority -->
<link rel="preload" as="image" href="/hero.avif" fetchpriority="high" />
<img src="/hero.avif" width="1200" height="630" fetchpriority="high" alt="Product hero" />
5. How to Fix CLS (Cumulative Layout Shift)
- Always set dimensions on images, videos and iframes (
width/heightor CSSaspect-ratio). - Reserve space for ads, embeds, cookie banners and dynamically injected content with a fixed
min-height. - Prevent font swaps from shifting text using
size-adjustfallback fonts (Next.jsnext/fontdoes this automatically). - Animate with transforms (
transform,opacity) instead oftop,heightormargin. - Insert new content below the viewport or in response to a user action, never above what the user is reading.
6. Prioritised Core Web Vitals Checklist
- Check Search Console to find which URL groups fail, on mobile or desktop.
- Add
web-vitalsattribution reporting to find the exact element or script responsible. - Fix the LCP image: no lazy-loading, high priority, correct size, modern format.
- Remove or defer unused third-party scripts.
- Split long tasks in your heaviest interactions (menus, filters, add to cart, forms).
- Set dimensions on all media and reserve space for dynamic content.
- Re-test in the field — CrUX data uses a rolling 28-day window, so allow about four weeks to see full results.
Want an expert to find and fix what is slowing your site down? ByteOperator runs technical performance audits, builds fast, modern websites and platforms, and offers ongoing support and maintenance. Get in touch for a free review.
Related reading:
- How Much Does Custom Software Development Cost in 2026? A Complete Pricing Guide
- AI Agents for Business: How to Automate Operations in 2026 (With Real Use Cases)
- Headless Commerce vs Traditional Ecommerce: Which Architecture Is Right for Your Brand?
- Technical SEO Checklist for 2026: 30 Checks to Get Your Site Crawled, Indexed and Ranked
- How to Build a SaaS MVP in 2026: A Step-by-Step Guide from Idea to Launch
- Generative Engine Optimization (GEO): How to Get Your Brand Cited in AI Search
- Ecommerce Platform Migration: How to Replatform Without Losing SEO Rankings
- Custom Shopify App Development (2026): Architecture, Remix & GraphQL
- Enterprise AI Automation & Agentic Workflows: Architecture & Guardrails (2026)
- Full-Stack SaaS Architecture with Next.js App Router & PostgreSQL (2026)
- Shopify to Custom Platform Migration: Architecture & Execution (2026)
- Shopify Speed Optimization Guide 2026: Core Web Vitals, LCP & Performance Best Practices
- MERN Stack Web Development Guide 2026: MongoDB, Express, React & Node.js
- API Integration Best Practices 2026: REST, GraphQL, Webhooks & Third-Party Reliability
- eCommerce Conversion Rate Optimization (CRO) Guide 2026: Tactics, Testing & Checkout
- How to Measure ROI on AI Automation: A Business Guide for 2026
- Web3 & Blockchain Development Guide 2026: Smart Contracts, dApps & DeFi
- React Performance Optimization Guide 2026: Bundle Size, Rendering & React 19
- Multi-Tenant SaaS Architecture Guide 2026: Database Models, Isolation & Scaling
- eCommerce Email Marketing Strategy 2026: Automation Flows, Segmentation & Klaviyo
- Cloud Cost Optimization Guide 2026: AWS, GCP & Azure FinOps Strategies
- Enterprise RAG Architecture Guide 2026: Vector Search, Hybrid Retrieval & LLM Systems
- Event-Driven Architecture & Microservices: Kafka, RabbitMQ & Distributed Systems
- DevOps & CI/CD Pipeline Best Practices 2026: GitOps, Kubernetes & Zero-Downtime Releases
- Web Application Security & OWASP Top 10 Guide: Hardening Full-Stack Applications
- Headless CMS Architecture with Next.js 2026: Sanity, Strapi & Contentful Comparison
- GraphQL vs REST API Architecture: Performance, Scalability & Best Practices in 2026
- SQL vs NoSQL Database Selection: PostgreSQL, MongoDB, Redis & DynamoDB Comparison
- Enterprise Prompt Engineering & LLM Architecture: Production Techniques for 2026
- Monolithic vs Microservices Architecture in 2026: The Modular Monolith & Beyond
- Cross-Platform Mobile App Architecture: React Native vs Flutter vs Swift & Kotlin 2026
- How to Choose a Software Development Company: 12-Point Checklist for 2026
- How to Write a Software Requirements Document (SRS) — Free Template & Examples
- n8n vs Zapier vs Make (2026): Which Workflow Automation Tool Should You Use?
- Technical Debt: How to Measure, Prioritise and Reduce It (Practical Guide)
Frequently asked questions
What is a good INP score?
A good Interaction to Next Paint score is 200 milliseconds or less at the 75th percentile of page visits. Scores between 200ms and 500ms need improvement, and anything above 500ms is rated poor.
Why does my Lighthouse score look good but Search Console says my pages fail?
Lighthouse runs a single lab test on a simulated device, while Search Console uses field data from real Chrome users on their own devices and networks. Real users often have slower phones and connections, and INP cannot be measured accurately in a lab without real interactions. Google ranks on field data.
How long does it take for Core Web Vitals improvements to show in Search Console?
Field data in the Chrome UX Report is based on a rolling 28-day window, so it usually takes around four weeks after deploying a fix for the full improvement to appear in Search Console and PageSpeed Insights.
Are Core Web Vitals a ranking factor?
Yes. Core Web Vitals are part of Google’s page experience signals. They act more like a tie-breaker than a dominant factor — relevance and content quality matter most — but faster pages also convert better, so improvements pay off even beyond rankings.