Conversion rate optimization (CRO) is the discipline of increasing the percentage of store visitors who complete a desired action — typically a purchase. For most eCommerce stores, even modest improvements to the conversion funnel can meaningfully impact revenue without requiring additional traffic acquisition spend.
This guide covers the principles, methodologies, and specific tactics that eCommerce teams can apply to improve conversion rates on Shopify stores and custom-built eCommerce platforms.
Note on Industry Benchmarks: Average eCommerce conversion rates vary significantly by industry, product category, traffic source, device type, and geography. Published industry averages are useful directional benchmarks but should not be treated as universal targets for your specific store. Focus on improving your own store's baseline rate over time rather than optimizing toward a published industry figure.
1. Understanding the eCommerce Conversion Funnel
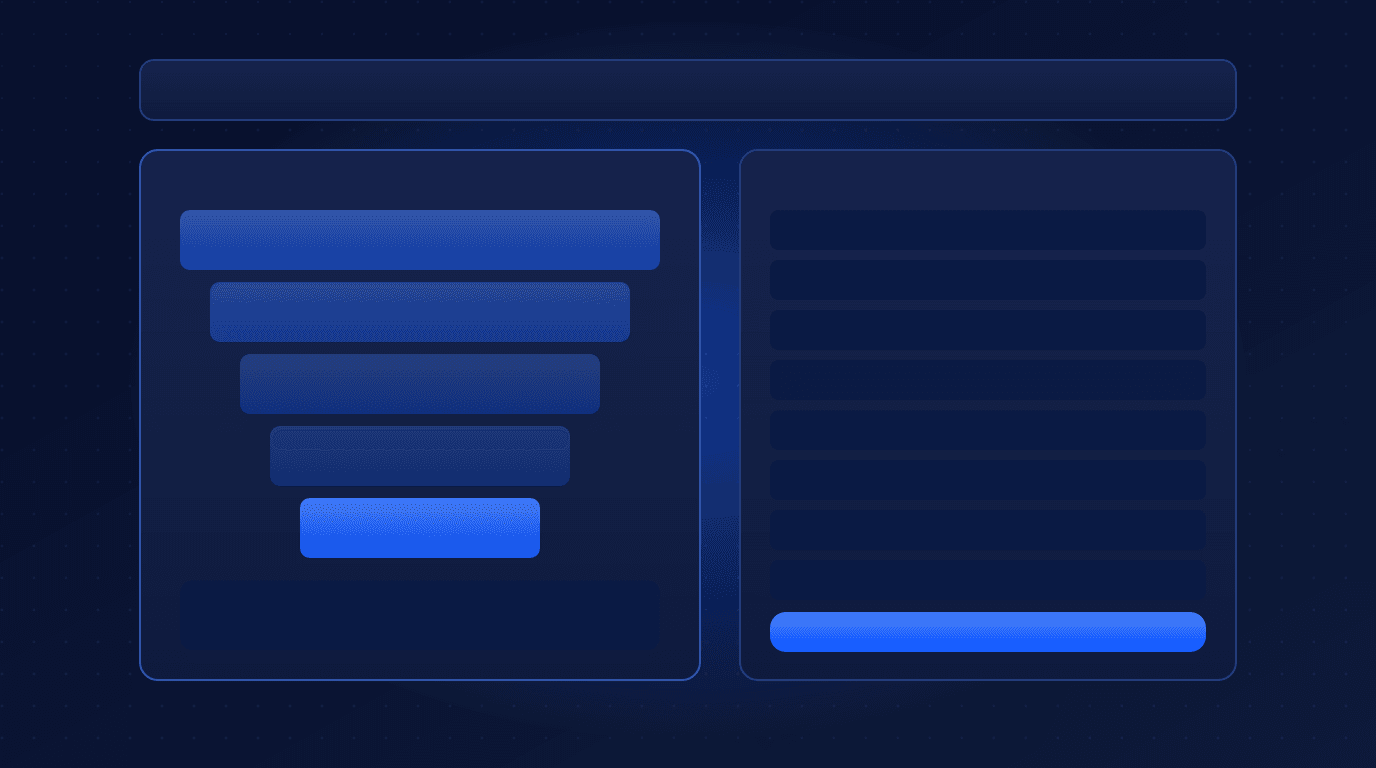
Before optimizing, map where users drop off in your specific funnel. A typical eCommerce funnel includes:
- Traffic Arrival: Visitor lands on homepage, collection page, or product page (from search, paid ads, social, email)
- Product Discovery: Visitor browses collections or searches for products
- Product Page Engagement: Visitor views product detail page, reviews images, reads description
- Add to Cart: Visitor adds product to cart
- Checkout Initiation: Visitor enters checkout flow
- Purchase Completion: Visitor completes payment
Use Google Analytics 4 (GA4) funnel exploration reports or a dedicated CRO tool (Hotjar, Microsoft Clarity, PostHog) to identify which step has the largest drop-off. Prioritize optimizing the step with the highest drop-off rate first — this gives the most leverage per optimization effort.
2. A/B Testing Methodology
A/B testing is the core quantitative method for CRO. A properly run A/B test compares a control variant (current design/copy) against a treatment variant (proposed change) with traffic split equally, running simultaneously, long enough to reach statistical significance.
Common A/B Testing Mistakes
- Stopping tests too early: Ending tests when you first see a positive result leads to false positives. Run tests until they reach your predetermined sample size (calculated based on expected effect size and statistical power before starting).
- Testing too many variables at once: If you change the button color, headline, and image simultaneously, you cannot attribute which change drove the result. Test one variable at a time for interpretable results (multivariate testing is an option but requires much larger sample sizes).
- Not accounting for seasonality: Running a test during a promotional period or holiday can contaminate results — users behave differently during sales events.
- Statistical significance vs. practical significance: A 0.1% lift with 99% statistical confidence may be real but commercially irrelevant. Define a minimum detectable effect (MDE) that would justify implementing the change before you start the test.
3. Product Page Optimization
The product detail page (PDP) is typically the highest-leverage conversion page for eCommerce stores. Key elements to optimize:
A. Product Images & Video
- Show the product from multiple angles with high-resolution images (minimum 1200px wide for zoom functionality)
- Include at least one lifestyle image showing the product in use context
- Add a short product video (15–30 seconds) for complex or high-consideration products — video can help address objections and communicate product benefits that images cannot convey
- Use a model for apparel (showing size on-body) and include size reference comparisons
B. Product Copy
- Lead with the primary customer benefit in the first sentence, not the product feature
- Use bullet points for key specifications — scannable format performs better than dense paragraphs for most product categories
- Address the most common objections in the description (size/fit, shipping time, return policy)
- Include schema markup (
Product,Offer,Review) for rich results in Google Shopping and organic search
C. Add-to-Cart Button
- Keep the Add to Cart button visible without scrolling on desktop and mobile (sticky bar on mobile if the button is below the fold)
- Use high-contrast button color that stands out from the page background
- Test button copy — "Add to Cart," "Buy Now," and "Get Yours" can perform differently depending on product category and audience
4. Checkout Optimization
Checkout abandonment is one of the highest drop-off points in most eCommerce funnels. Key optimization areas:
A. Reduce Checkout Steps
Fewer form fields and checkout steps consistently correlate with higher completion rates. Evaluate which fields are truly necessary — many stores collect information they do not use. For Shopify stores, the native one-page checkout (introduced in Shopify's 2023 checkout update) reduces friction significantly versus multi-page checkouts.
B. Offer Guest Checkout
Requiring account creation before purchase is a significant conversion barrier, particularly for first-time customers. Allow guest checkout and offer account creation as a post-purchase step with a clear benefit articulation (e.g., "Create an account to track your orders").
C. Display Trust Signals at Checkout
- Security badges and SSL indicators near payment fields
- Clear return policy summary (without requiring the customer to navigate away)
- Multiple payment method options (credit card, PayPal, Shop Pay, Apple Pay, Google Pay)
- Transparent total including taxes and shipping — avoid revealing unexpectedly high costs at the final step
D. Address Shipping Cost Friction
Unexpected shipping costs at checkout are one of the most commonly cited reasons for cart abandonment. Strategies to reduce this friction:
- Display shipping cost estimates on the product page or cart page before checkout begins
- Offer a free shipping threshold (e.g., "Free shipping on orders over $X") — prominently display this and show how much more the customer needs to qualify
- If free shipping is not viable, be transparent about shipping costs early in the funnel
5. Social Proof & Trust Signals
Social proof — evidence that other customers have purchased and been satisfied — reduces purchase uncertainty and can increase conversion rates, particularly for new visitors who are unfamiliar with your brand.
- Customer Reviews: Display aggregated star ratings and individual written reviews on product pages. Authenticated reviews (from verified purchasers) carry more credibility than uncertified reviews.
- Review Volume: A product with many moderate reviews often converts better than one with few perfect reviews, as volume signals purchase history and reduces perceived risk.
- User-Generated Content (UGC): Customer photos and videos showing the product in real-world use can be highly persuasive, particularly for fashion, home décor, and lifestyle product categories.
- Press & Media Mentions: "As featured in" logos from recognized publications increase brand credibility for customers who are unfamiliar with your store.
6. Page Speed as a CRO Factor
Page load time directly affects conversion rates. Slow product pages cause impatient users to bounce before the page fully loads, before they can add to cart. Research from multiple web performance studies has consistently found correlation between faster page loads and higher conversion rates — though the magnitude of the effect depends on your specific traffic composition and product type.
Targeting a Largest Contentful Paint (LCP) under 2.5 seconds and a Total Blocking Time (TBT) under 200ms on mobile devices is a good starting performance goal. See our Shopify speed optimization guide for implementation details.
7. Mobile CRO
Mobile accounts for a substantial share of eCommerce traffic, but typically converts at lower rates than desktop — partly due to UX friction that mobile shoppers encounter more acutely.
Mobile-specific CRO priorities:
- Tap target sizes: Buttons and interactive elements should be at least 44×44px to be reliably tappable without zooming
- Simplified navigation: Mobile menus should collapse non-critical navigation behind a hamburger menu to reduce visual clutter
- Mobile payment methods: Shop Pay, Apple Pay, and Google Pay one-tap checkout dramatically reduce mobile checkout friction by eliminating manual card entry
- Text input minimization: Reduce the number of text fields on mobile checkout forms — use address autocomplete and saved payment information wherever possible
Looking to improve your eCommerce store's conversion performance? Explore our Shopify development services, browse our portfolio of eCommerce projects, or speak with our team about a CRO audit for your store.
Related reading:
- How Much Does Custom Software Development Cost in 2026? A Complete Pricing Guide
- AI Agents for Business: How to Automate Operations in 2026 (With Real Use Cases)
- Headless Commerce vs Traditional Ecommerce: Which Architecture Is Right for Your Brand?
- Technical SEO Checklist for 2026: 30 Checks to Get Your Site Crawled, Indexed and Ranked
- How to Build a SaaS MVP in 2026: A Step-by-Step Guide from Idea to Launch
- Generative Engine Optimization (GEO): How to Get Your Brand Cited in AI Search
- Ecommerce Platform Migration: How to Replatform Without Losing SEO Rankings
- Custom Shopify App Development (2026): Architecture, Remix & GraphQL
- Enterprise AI Automation & Agentic Workflows: Architecture & Guardrails (2026)
- Full-Stack SaaS Architecture with Next.js App Router & PostgreSQL (2026)
- Shopify to Custom Platform Migration: Architecture & Execution (2026)
- Shopify Speed Optimization Guide 2026: Core Web Vitals, LCP & Performance Best Practices
- MERN Stack Web Development Guide 2026: MongoDB, Express, React & Node.js
- API Integration Best Practices 2026: REST, GraphQL, Webhooks & Third-Party Reliability
- How to Measure ROI on AI Automation: A Business Guide for 2026
Frequently asked questions
What is a good eCommerce conversion rate?
Conversion rates vary significantly by industry, product category, traffic source, and device type, so published averages are useful directional benchmarks rather than universal targets. Focus on consistently improving your own store's baseline rate over time using A/B testing. A meaningful improvement from your current baseline — even a fraction of a percentage point for high-traffic stores — has more practical value than hitting a published industry benchmark.
What is the single highest-impact checkout optimization?
Reducing checkout steps and form fields typically has the highest impact. Specifically: allowing guest checkout (removing required account creation), displaying all costs (shipping, taxes) before the final checkout step to eliminate surprise costs, and offering express payment options (Shop Pay, Apple Pay, Google Pay) to remove manual card entry friction on mobile.
How long should I run an A/B test before making a decision?
Run A/B tests until they reach a pre-determined sample size calculated before the test starts — based on your current conversion rate, the minimum effect size you want to detect, and your desired statistical power (typically 80–95%). Stopping tests early when you see a positive result is a common mistake that leads to false positives. For lower-traffic stores, this may mean running tests for 2–4 weeks or longer.
Does faster page speed actually improve conversion rates?
Research consistently finds correlation between faster page load times and higher conversion rates, particularly on mobile devices. However, the magnitude of the effect depends on your baseline load time, product type, and audience. Reducing LCP from 6 seconds to 2 seconds is likely to have a more meaningful impact than reducing it from 2.5 to 2.0 seconds. Page speed is one factor among many — it is most impactful when other fundamentals (product-market fit, pricing, trust signals) are already strong.